June 10 gambler's prediction
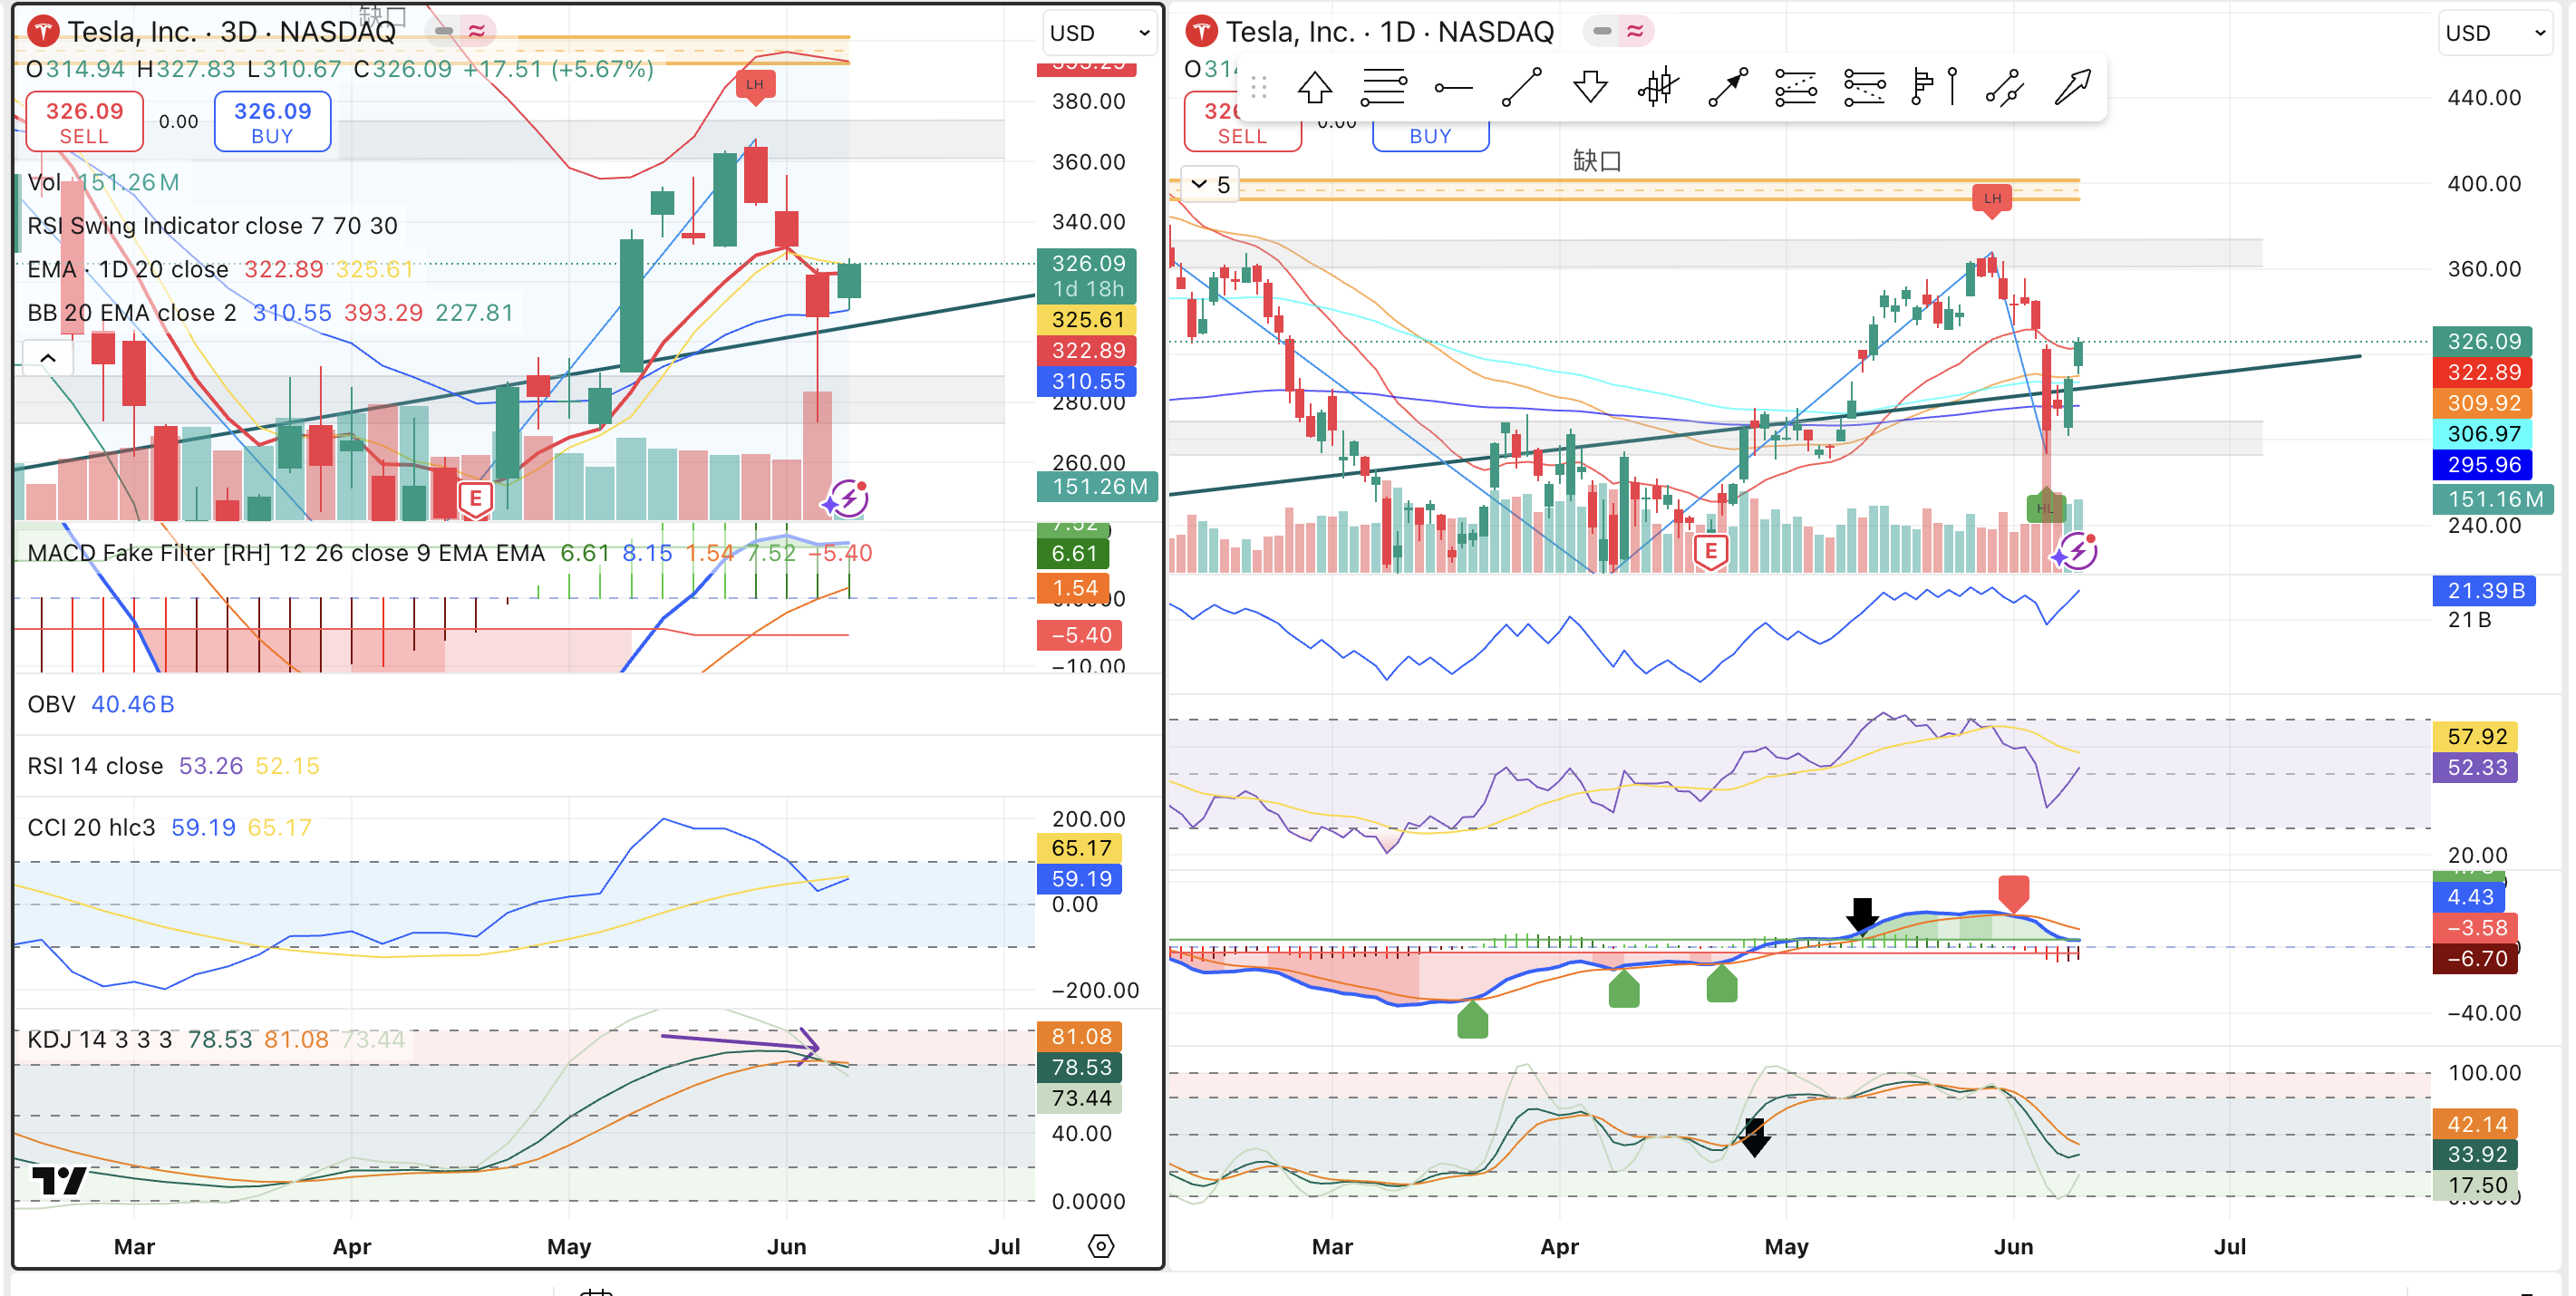
TSLA:

In the 3D chart, we can see the 3D candle test 20 EMA and be supported. It shows a 2-2 reversal as it is a support zone regarding to both key support zone(the grey area) and the 20 EMA for 3 day chart.
As we shift our attention to the daily chart, we can see a 2-1-3 reverse pattern form at the key support zone. And the first target has been hit. While I missed it, realize the daily candle cross 20 EMA on daily chart which is a bullish sign, we can set our target to next resistance zone which is around 360.
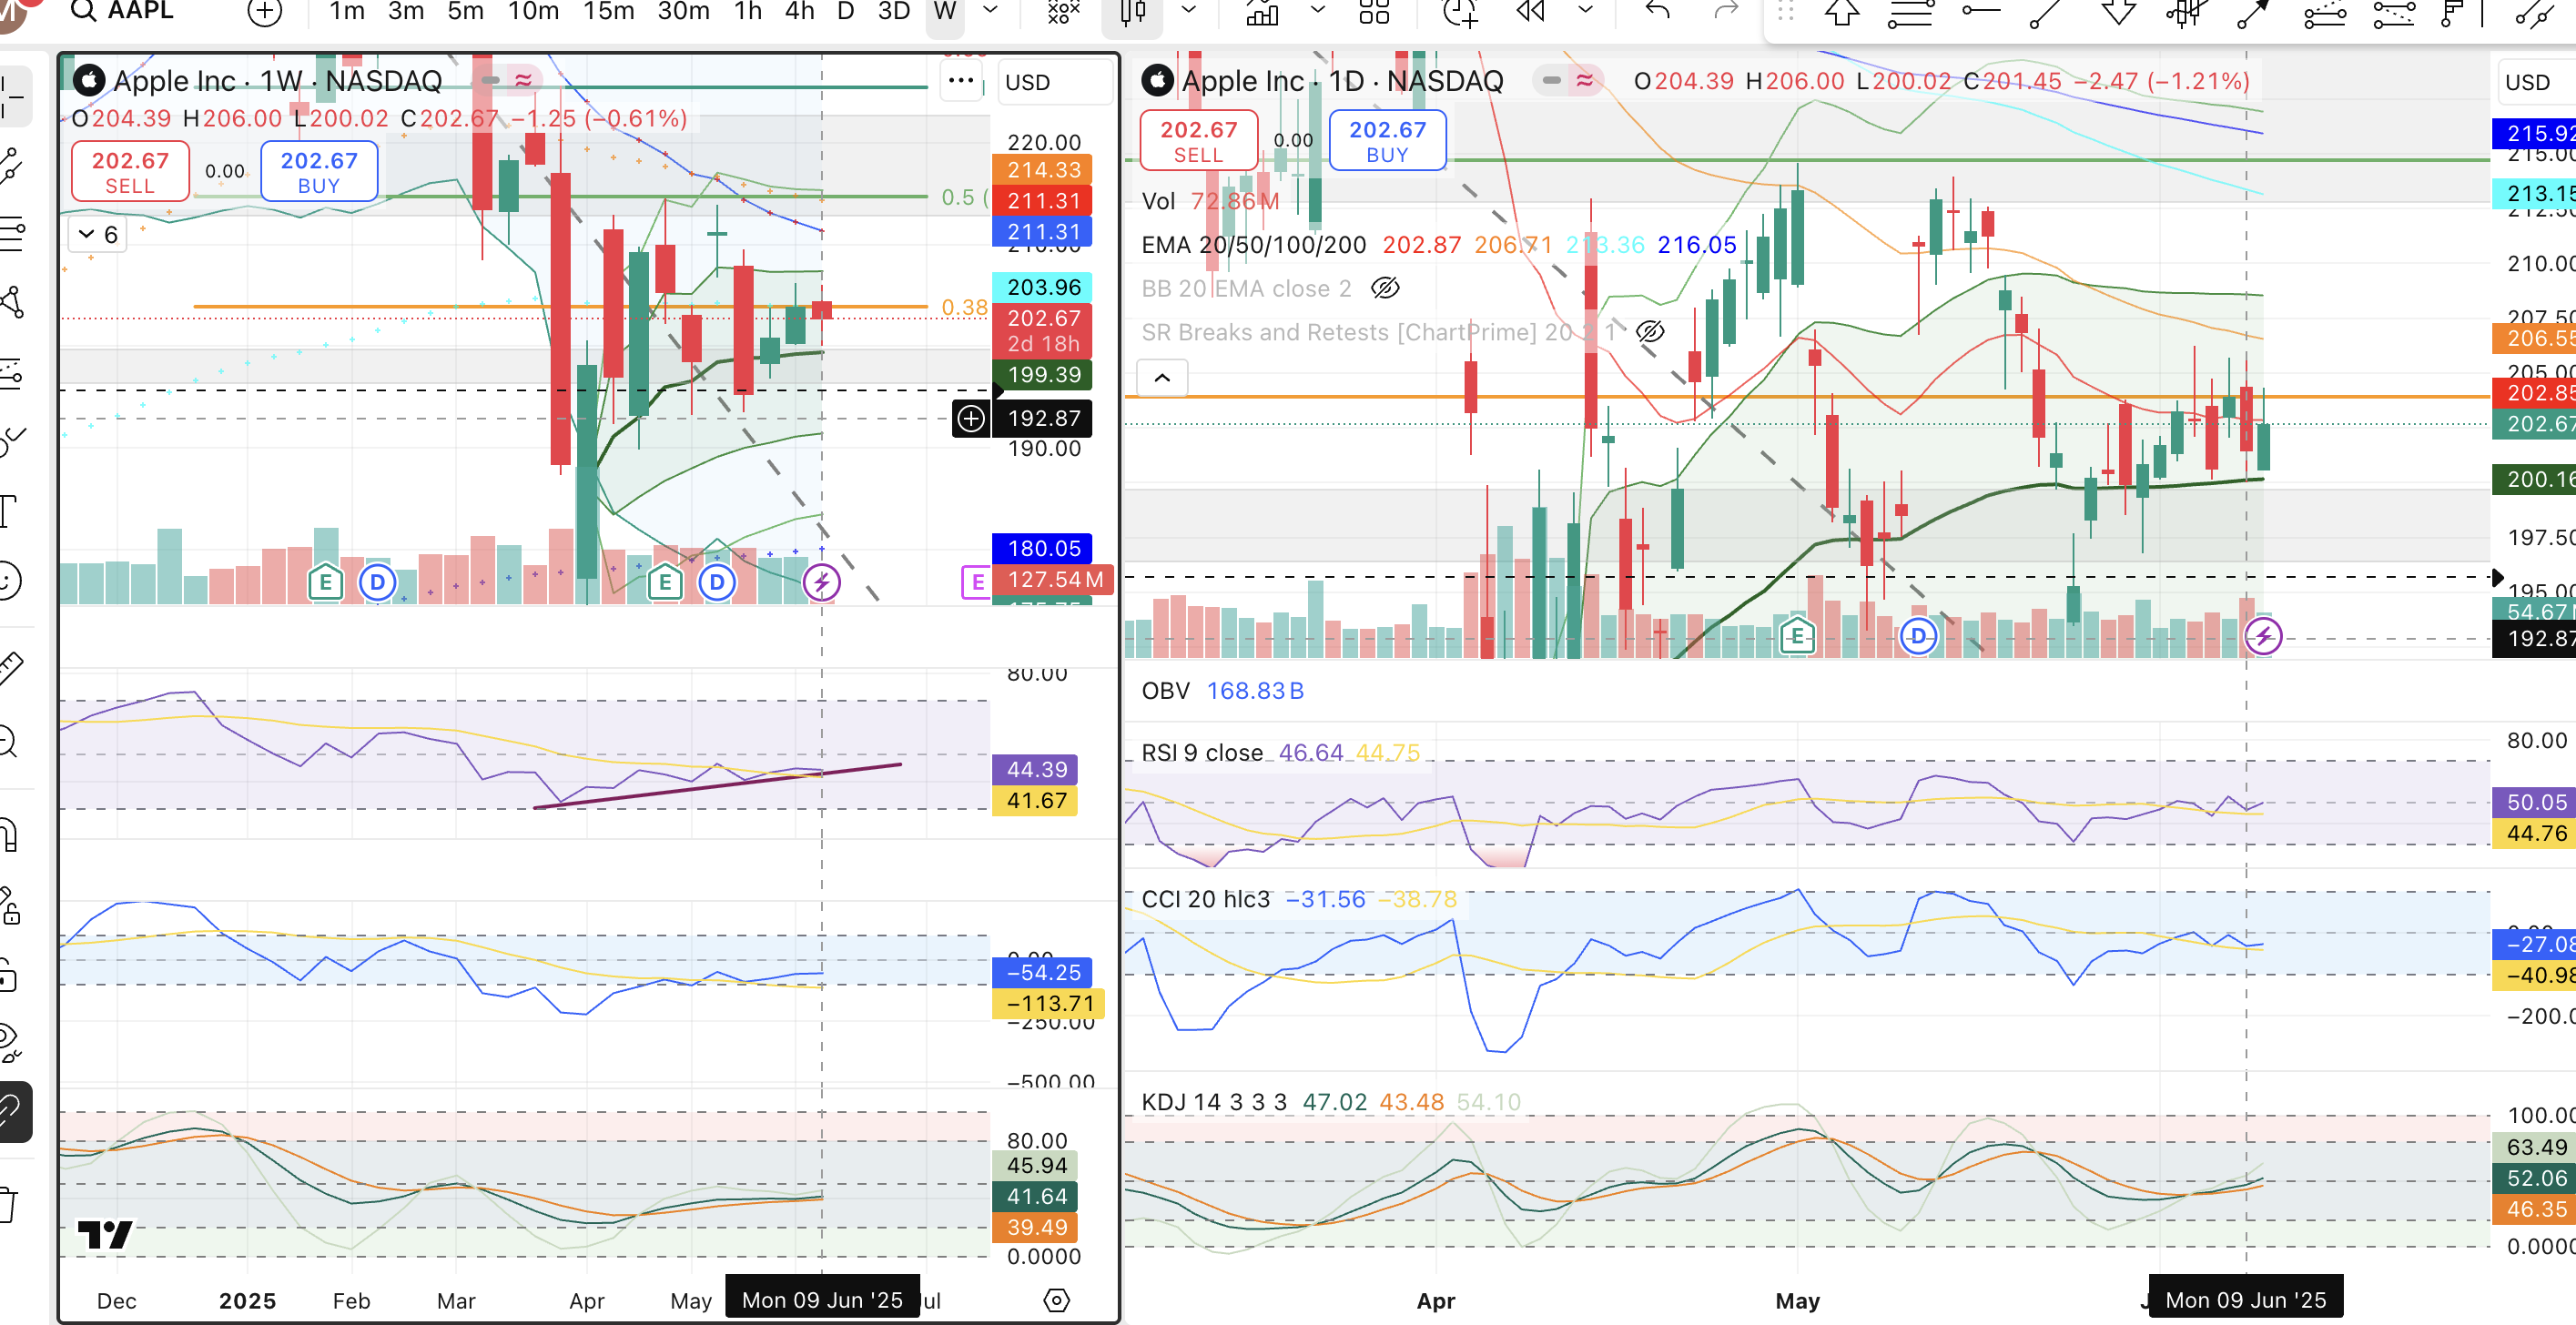
AAPL:

The RSI for aapl seems to be bullish but the uptrend is relatively flat. We can even spot the aapl stock market is mostly ranging and act like a symmetric triangle with a doji at the top. The 1w chart show candle below bolinger band mid-line, it is a 2-1-2 reverse pattern. So far so good, but! the current red candle break the 2U bar's low, it will either be a 2D candle or a 3 candle. Which is not a desired setup.
Look at the daily chart, the aVWAP act as a support. But no clear trend is given. uptrend for daily rsi is break so this should wait for clear reverse signal.
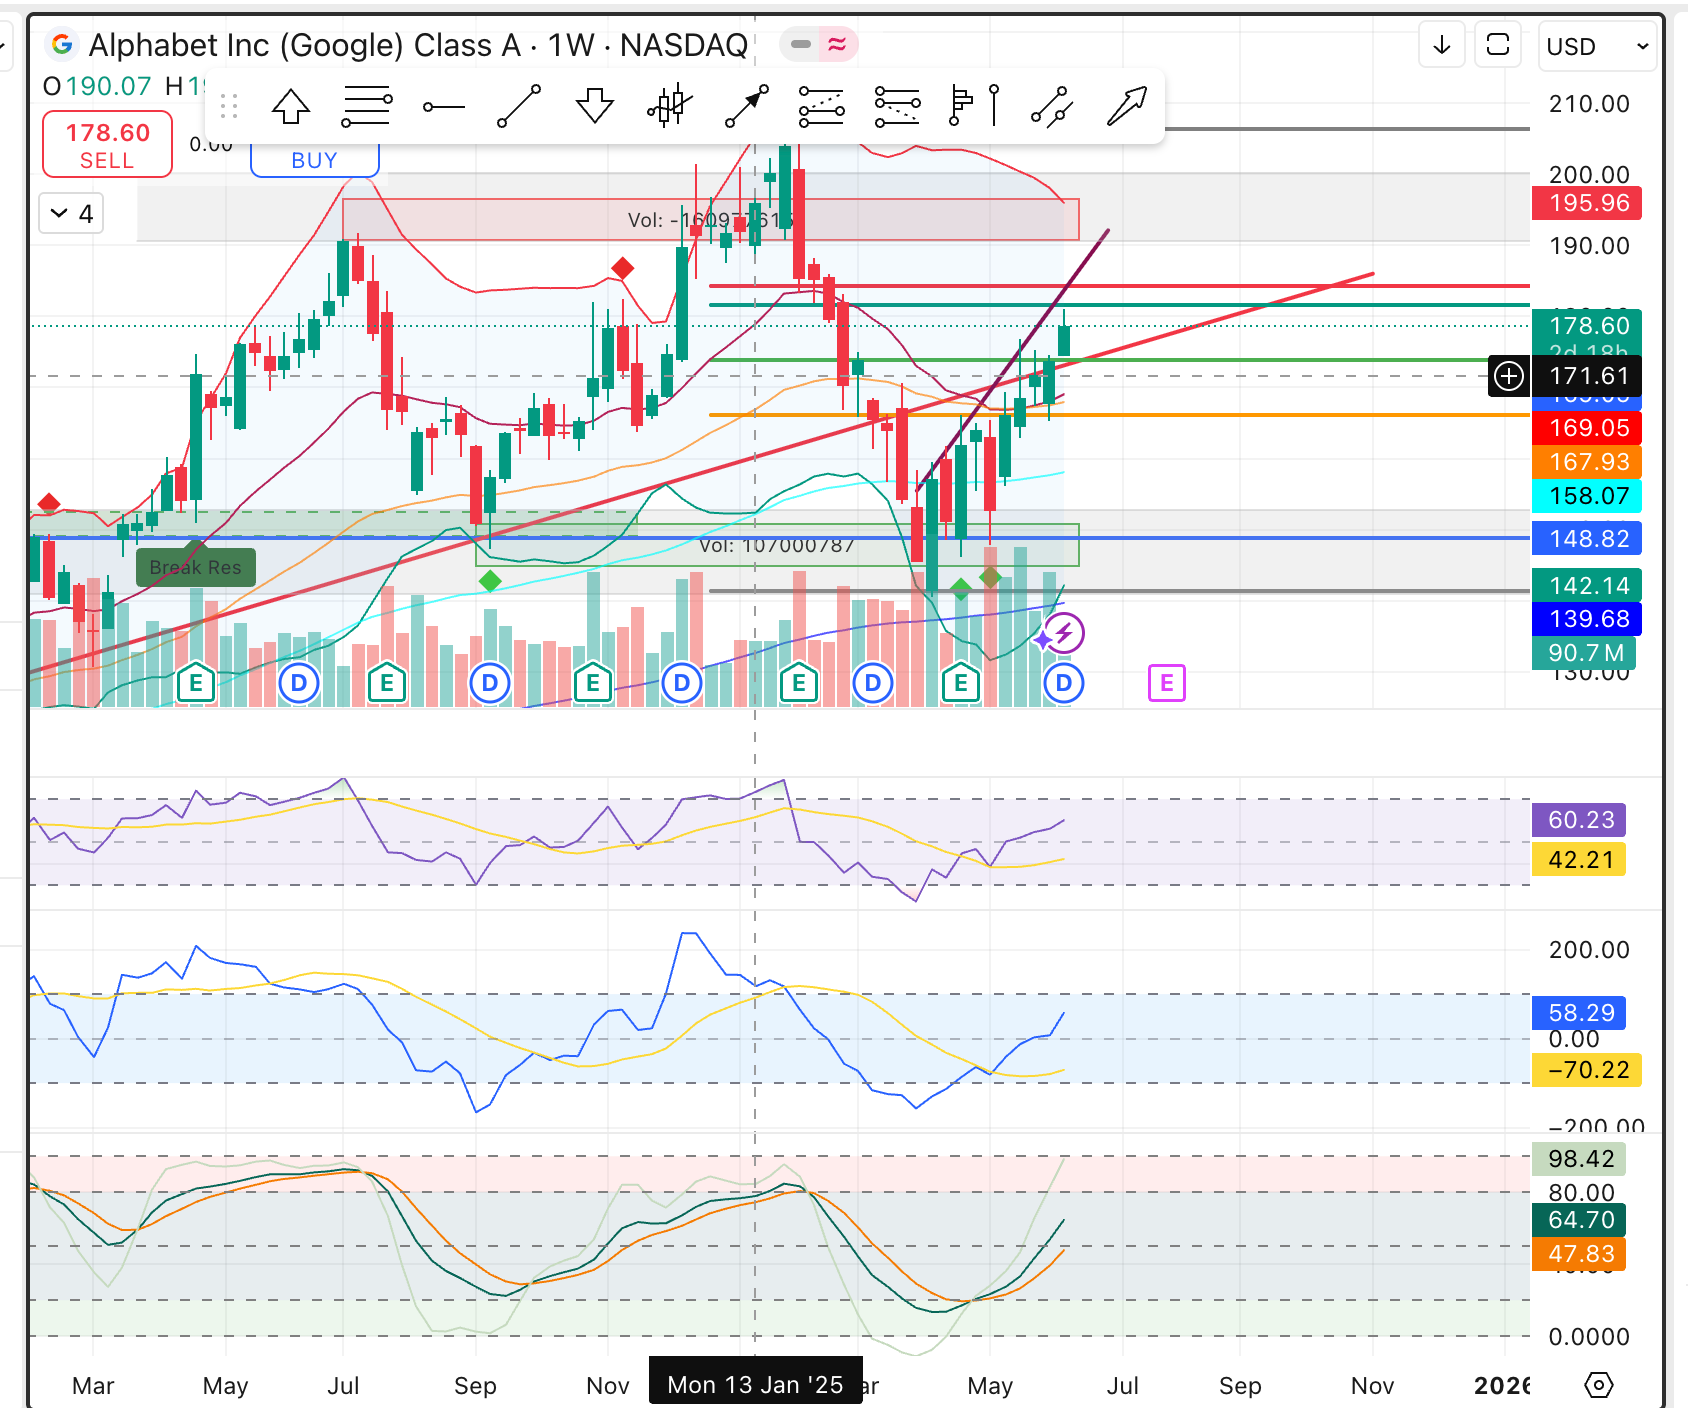
GOOGL

First we look at GOOGL weekly chart. There is an interesting phenomenon here, we spot a 2U-1-2D right at the Bollinger Band mid-line. While normal 2-1-2 with the last 2 bar break the 1 bar's low should be a reverse patter, here it is just a continuation pattern. The reasons behind this might be:
- The 20 daily EMA might not be a resist zone, we should only consider the the key support/resistance zone.
- The oscillator are not in the overbought zone, so this should not be a reverse pattern. (This might be wrong as reverse pattern reach key resistance as TSLA which oscillator does not show oversold is reversed.)
- Or it is being resisted by the 0.5 line but is supported by the EMA line, so we should always wait for confirmation.

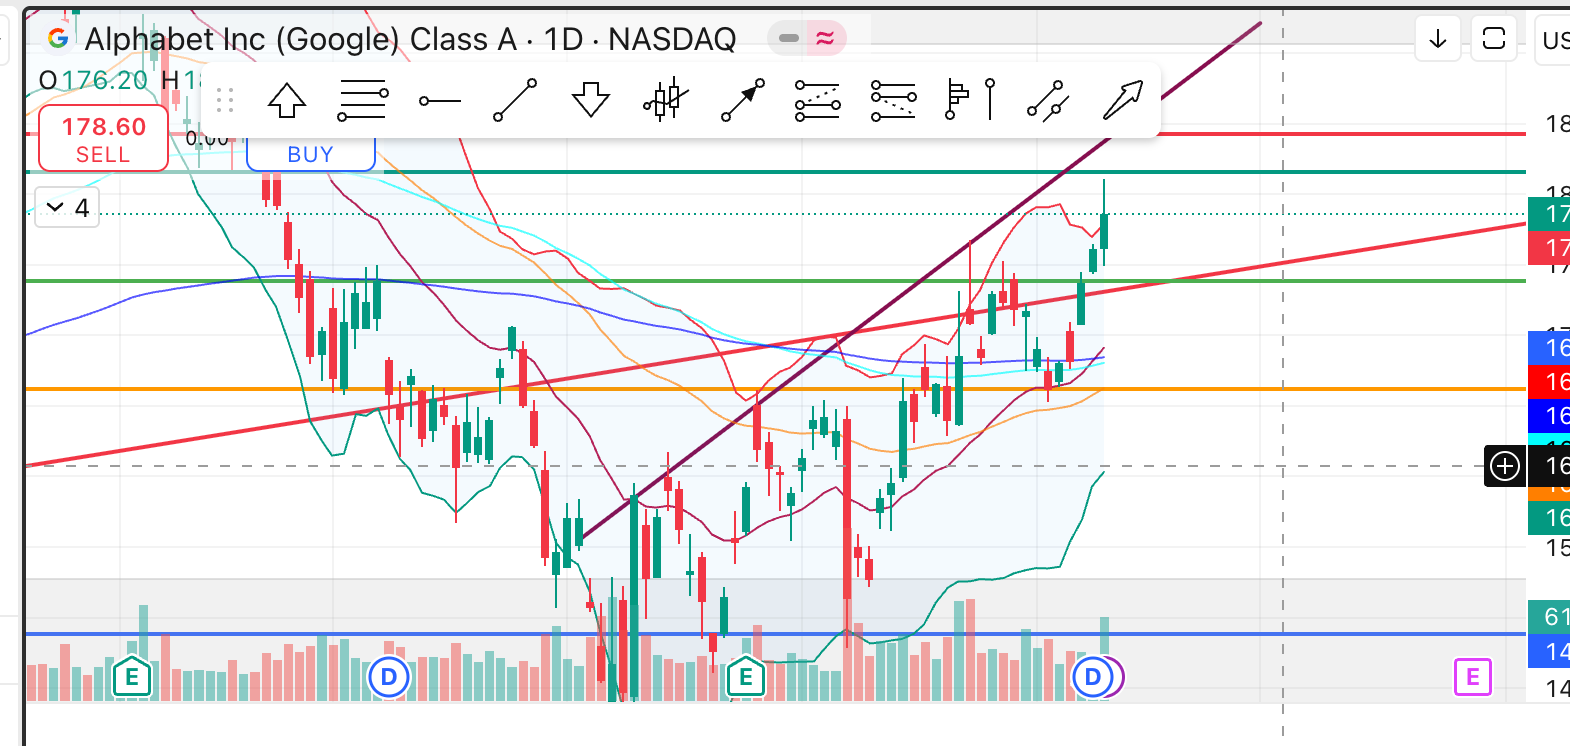
The daily chart show a bullish setup, but one warning sign is that it broke the bollinger band's high, so we should expect either the price will go down or it will range for a while. The dark green line is the 61.8% line, we should expect the price to hit it and reverse back to the 0.5 line and go back up again. So we should wait on googl to act.
VST:
